Performance highlights
| 2014 | 2013 | % change | ||
| Income (Rm) | 10 767 | 9 910 | 9 | |
| Ebitdar (Rm) | 4 214 | 3 888 | 8 | |
| Ebitdar margin (%) | 39.1 | 39.2 | (0.1pp) | |
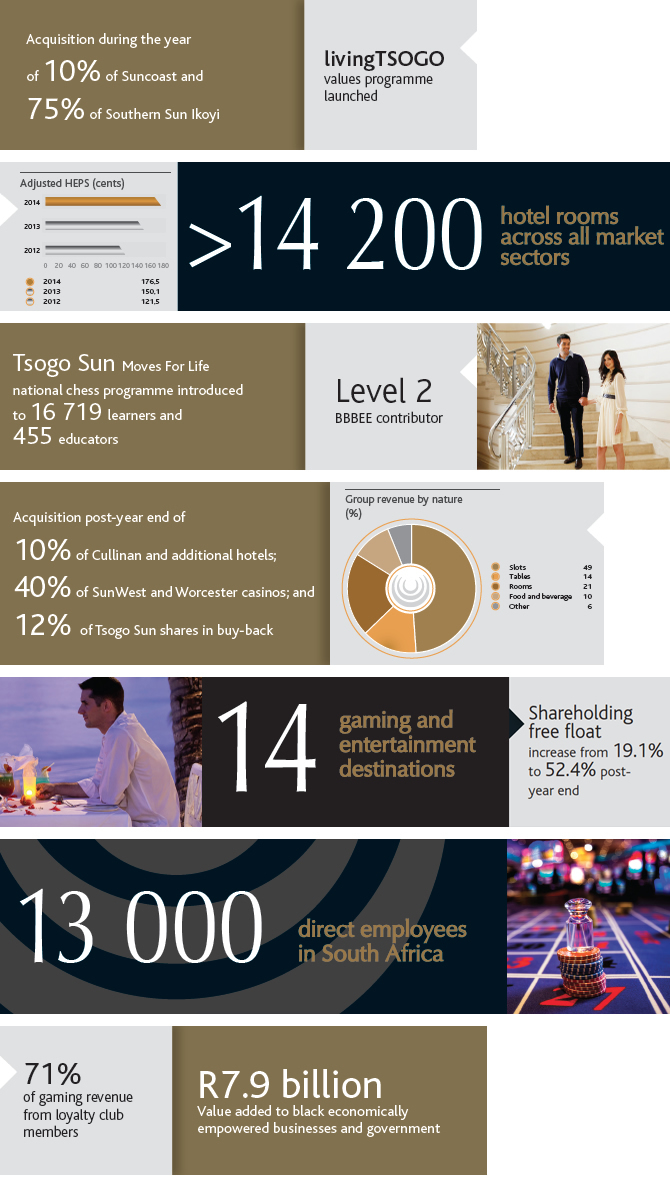
| Adjusted headline earnings per share (cents) | 176.5 | 150.3 | 18 | |
| Dividend for the year per share (cents) | 89.0 | 75.0 | 19 | |
| Free cash flow (Rm) | 1 825 | 1 932 | (6) | |
| Maintenance capital expenditure (Rm) | 769 | 579 | ||
| Investment activities (Rm) | 1 643 | 639 | ||